Most Malaysian sellers check their sales number. Few check why it moved.
That gap is expensive. A store can run three ad campaigns, publish ten posts, and still not know which one actually paid for itself, because nobody set up the analytics to answer that question. Fixing this doesn’t require a data team. It requires the right three tools, tracking the right handful of numbers, reviewed on a schedule.
| 10M events/mo | 1.5-3% | RM 0-800/mo |
| GA4’s free-tier processing limit, per Google’s official documentation, well above what most Malaysian SME stores generate | Typical ecommerce conversion rate range, per Littledata and IRP Commerce benchmark reports | Reasonable monthly analytics stack cost for a Malaysian SME store (tools + attribution) |
What Is Ecommerce Analytics?
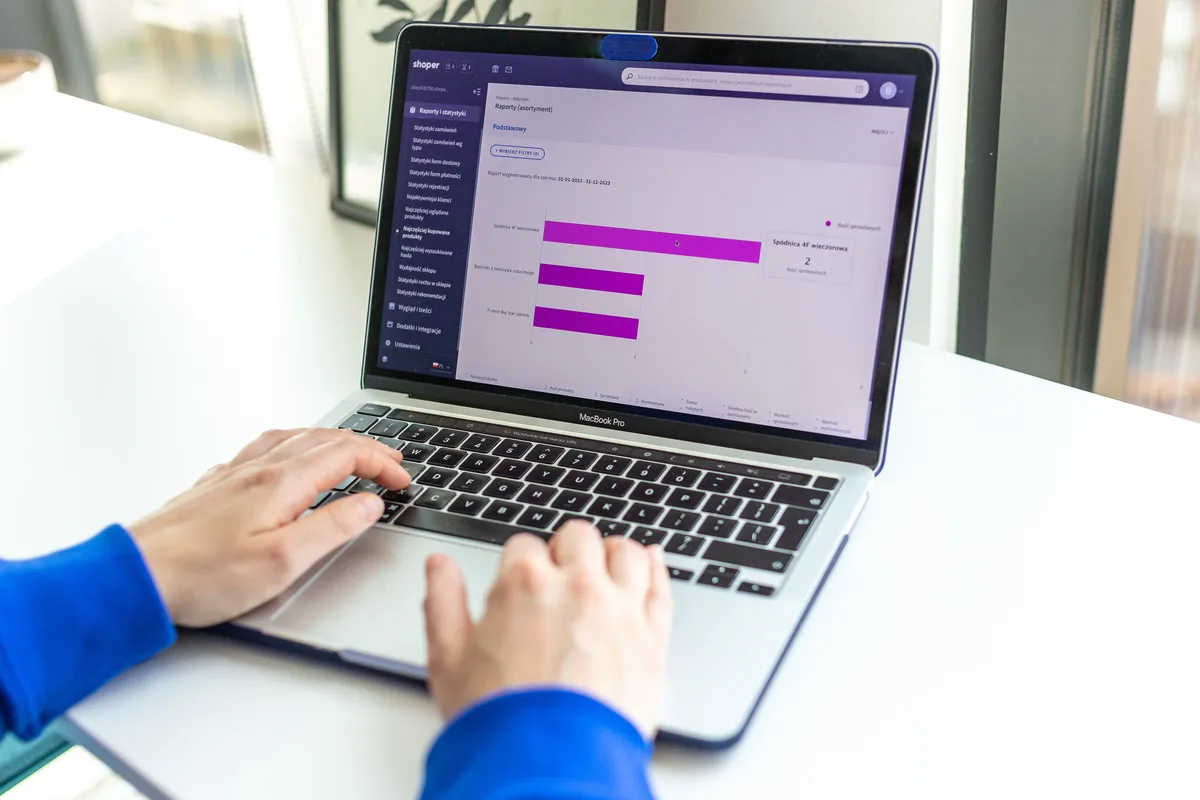
Ecommerce analytics is the practice of collecting, tracking, and reviewing data on store traffic, customer behavior, and sales performance to guide marketing and product decisions. It draws from three main sources: a web analytics platform (Google Analytics 4), your store platform’s native dashboard, and marketplace seller centers, combined into a single view of what’s working.
Without it, marketing is guesswork dressed up as strategy. A seller doubles down on Facebook Ads because “it feels like it’s working,” while TikTok Shop is quietly delivering more orders at a lower cost. Analytics replaces that feeling with a number.
The practice isn’t complicated. It’s three habits done consistently: install the right tracking, watch the right metrics, and review them on a fixed schedule rather than only when sales drop. Most Malaysian SME stores fail at the third habit, not the first two. The tools get installed once during setup and never opened again.
Which Ecommerce Analytics Metrics Actually Matter for Malaysian Sellers?
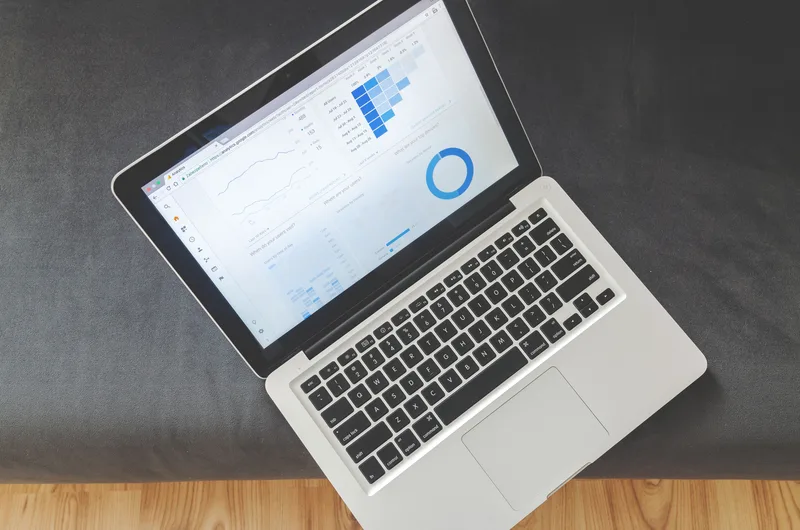
The core metrics worth tracking are conversion rate, average order value (AOV), traffic by channel, customer acquisition cost (CAC), and repeat purchase rate. Together, these five numbers answer whether visitors buy, how much they spend, where they came from, what it cost to get them, and whether they come back, covering the full store funnel without drowning a seller in dashboards.
Rank these by how often you check them:
Conversion rate. The percentage of visitors who complete a purchase. Most ecommerce stores convert 1.5-3% of visitors, per Littledata’s ecommerce conversion rate benchmark, with Shopee MY and Lazada MY sellers often seeing higher marketplace conversion thanks to built-in buyer trust.
Average order value (AOV). Total revenue divided by number of orders. A store that lifts AOV from RM 80 to RM 100 through bundling or a free-shipping threshold grows revenue without spending a single ringgit more on traffic.
Traffic by channel. Which source sent the visit: organic search, Meta Ads, TikTok, email, or direct. This is the number that should decide next month’s ad budget, not gut feeling about which platform “seems popular.”
Customer acquisition cost (CAC). Total marketing spend divided by new customers gained. Without this, a seller can’t tell if a channel is profitable or just busy. Run your current spend through our free ad budget calculator to see where CAC sits relative to your margins.
Repeat purchase rate. The share of customers who buy a second time. Acquiring a new customer typically costs several times more than retaining an existing one, which makes this the metric most SME sellers under-track relative to its impact on margin.
Check conversion rate and traffic by channel weekly. Check AOV, CAC, and repeat rate monthly, since they move more slowly and daily noise just adds confusion.
Which Ecommerce Analytics Tools Should Malaysian Sellers Use?
The core stack for a Malaysian ecommerce store is Google Analytics 4 (free, web and app traffic), your platform’s native dashboard (Shopify Analytics or WooCommerce reports, free with the platform), and marketplace seller centers (Shopee Seller Centre, Lazada Seller Center, free with the marketplace account). A paid heatmap or attribution tool is optional until a store clears roughly RM 20,000 in monthly revenue.
Each tool covers a different blind spot:
- Google Analytics 4 (GA4). Tracks visitor behavior across your entire site: which pages get traffic, where visitors drop off, and which channel drove the session. Free for up to 10 million events a month, per Google’s GA4 data limits documentation, which covers nearly every Malaysian SME store.
- Shopify Analytics or WooCommerce reports. Native to your store platform, these show order-level data GA4 can’t: exact revenue by product, refund rates, and inventory-linked sales trends. Included in your platform subscription at no extra cost.
- Shopee Seller Centre and Lazada Seller Center. Marketplace-native dashboards showing shop visitors, conversion rate, and product-level performance inside that specific marketplace. These numbers stay siloed inside the marketplace and don’t appear in GA4, so sellers running both a standalone store and marketplace shops need to check both.
- Meta Ads Manager and TikTok Ads Manager reporting. Platform-native ad performance data. Cross-reference this against GA4 and your platform’s order data rather than trusting the platform’s own attribution alone, since ad platforms tend to over-credit themselves for conversions.
Most Malaysian sellers only need these four, all free. A paid third-party attribution or heatmap tool (Hotjar, Microsoft Clarity’s free tier, or a dedicated attribution platform) becomes worth adding once a store is running multiple paid channels simultaneously and needs to untangle which one actually drove a given sale.

How Do You Set Up Google Analytics 4 for an Ecommerce Store in Malaysia?
Setting up GA4 for ecommerce means creating a GA4 property, installing the tracking snippet (directly or via Google Tag Manager), enabling Enhanced Ecommerce events for your platform, and linking Google Ads if you run paid campaigns. Shopify and WooCommerce both support GA4 through official apps or plugins, which handle most of the event tracking automatically.
The setup sequence:
- Create a GA4 property in your Google Analytics account and set the reporting time zone to Malaysia (GMT+8) and currency to MYR, so revenue figures match your store’s actual currency instead of defaulting to USD.
- Install tracking. Shopify stores can use the official Google & YouTube channel app; WooCommerce stores typically use a plugin like Site Kit by Google or a GA4 tracking plugin. Either method installs the base tracking snippet without touching theme code directly.
- Enable Enhanced Ecommerce events. This turns on tracking for product views, add-to-cart actions, checkout steps, and purchases, the events that let you see exactly where visitors drop off in the funnel rather than just total sessions.
- Link Google Ads, if you run paid search or Shopping campaigns, so ad performance data flows into the same reports as your organic and social traffic.
- Set up conversion events for purchase and, optionally, for high-intent actions like add-to-cart, so GA4 can report conversion rate directly instead of you calculating it manually from raw numbers.
Budget half a day for this if you’re doing it yourself, or expect a freelance developer to complete it in 2-3 hours for a standard Shopify or WooCommerce setup. Once installed, verify it’s working using GA4’s Realtime report: visit your own store, add something to cart, and confirm the event appears within a minute or two.
How Do You Turn Ecommerce Analytics Data Into Marketing Decisions?
Turning analytics into decisions means reviewing traffic-by-channel and conversion-rate data monthly, then reallocating budget toward the channel with the lowest customer acquisition cost and highest conversion rate. Data without a review schedule just sits in a dashboard; the value comes from acting on it at a fixed cadence, not from collecting more of it.
Set a simple monthly review process:
Pull channel performance side by side. List each traffic source (organic search, Meta Ads, TikTok, email, marketplace) with its sessions, conversion rate, and CAC in one view. The channel with the best conversion rate and lowest CAC is where next month’s incremental budget should go.
Compare against your ROAS target. If a channel’s return on ad spend consistently misses your target, that’s a signal to pause or restructure it, not a signal to spend more hoping it improves. Run current numbers through our free ROAS calculator before making the call.
Watch for a channel silently underperforming. A channel can maintain decent total revenue while its conversion rate quietly declines, masked by rising traffic volume. Reviewing rate, not just raw revenue, catches this before it becomes a bigger problem.
Connect analytics to content and campaign decisions. If GA4 shows a blog post driving strong organic traffic but low conversion, that’s a signal to add a stronger call to action or product link, not to abandon the topic. Data should adjust existing work before it triggers something entirely new.
Do this monthly at minimum. Weekly reviews of conversion rate and traffic by channel catch problems faster, but monthly is the floor for a decision to actually be worth making.

Not sure if your current ad spend is actually earning its keep? Run your numbers through our free ROAS calculator. Two minutes, no signup required.
How Much Should You Budget for Ecommerce Analytics Tools?
Most Malaysian SME stores can run a functional analytics setup for RM 0-800 a month. GA4, platform-native dashboards, and marketplace seller centers are free. A paid heatmap or attribution tool (RM 150-800/month) becomes worth adding once a store runs multiple paid channels at once and revenue clears roughly RM 20,000 a month.
Break it into tiers by store size:
Under RM 20,000/month revenue. Free tools only: GA4, your platform’s native dashboard, and marketplace seller centers. Time spent reviewing the data matters more than tool spend at this stage.
RM 20,000-80,000/month revenue. Add a paid heatmap or session-recording tool (typically RM 150-400/month) to see where visitors actually drop off on key pages, and consider a lightweight attribution tool if you’re running three or more paid channels at once.
Above RM 80,000/month revenue. A dedicated multi-touch attribution platform and a scheduled monthly or quarterly analytics review with a specialist become worth the cost, since even a small shift in channel allocation moves meaningful revenue at that volume.
Whatever the budget, sequence matters more than spend: get GA4 and platform dashboards installed correctly first, build the habit of a monthly review, then add paid tools once the free stack stops answering your questions.
Frequently Asked Questions
What is ecommerce analytics?
Ecommerce analytics is the practice of collecting and reviewing data on store traffic, customer behavior, and sales to guide marketing and product decisions. Core sources include Google Analytics 4, your store platform’s native dashboard (Shopify, WooCommerce), and marketplace seller centers like Shopee and Lazada.
Is Google Analytics 4 free for Malaysian ecommerce stores?
Yes. GA4’s free tier covers up to 10 million events per month, per Google’s official documentation, which is far more than most Malaysian SME stores generate. Only very high-traffic stores need the paid Google Analytics 360 tier.
Which ecommerce KPIs should a Malaysian seller track first?
Start with conversion rate, average order value, and traffic by channel. These three numbers show whether your store is turning visitors into buyers, how much each order is worth, and which marketing channel deserves more budget, before adding more granular metrics.
How much does an ecommerce analytics stack cost for an SME store?
Most Malaysian SME sellers can run a functional analytics stack for RM 0-800 a month: GA4 and platform-native dashboards are free, and a paid attribution or heatmap tool typically costs RM 150-800 monthly. Enterprise-grade attribution platforms cost more but are rarely necessary below RM 80,000 in monthly revenue.
Do Shopee and Lazada provide their own analytics, or do I need Google Analytics too?
Shopee Seller Centre and Lazada Seller Center both provide native analytics on shop visitors, conversion, and product performance within their marketplace. Sellers running a standalone Shopify or WooCommerce store alongside marketplace shops still need GA4, since marketplace dashboards only cover traffic inside that marketplace.